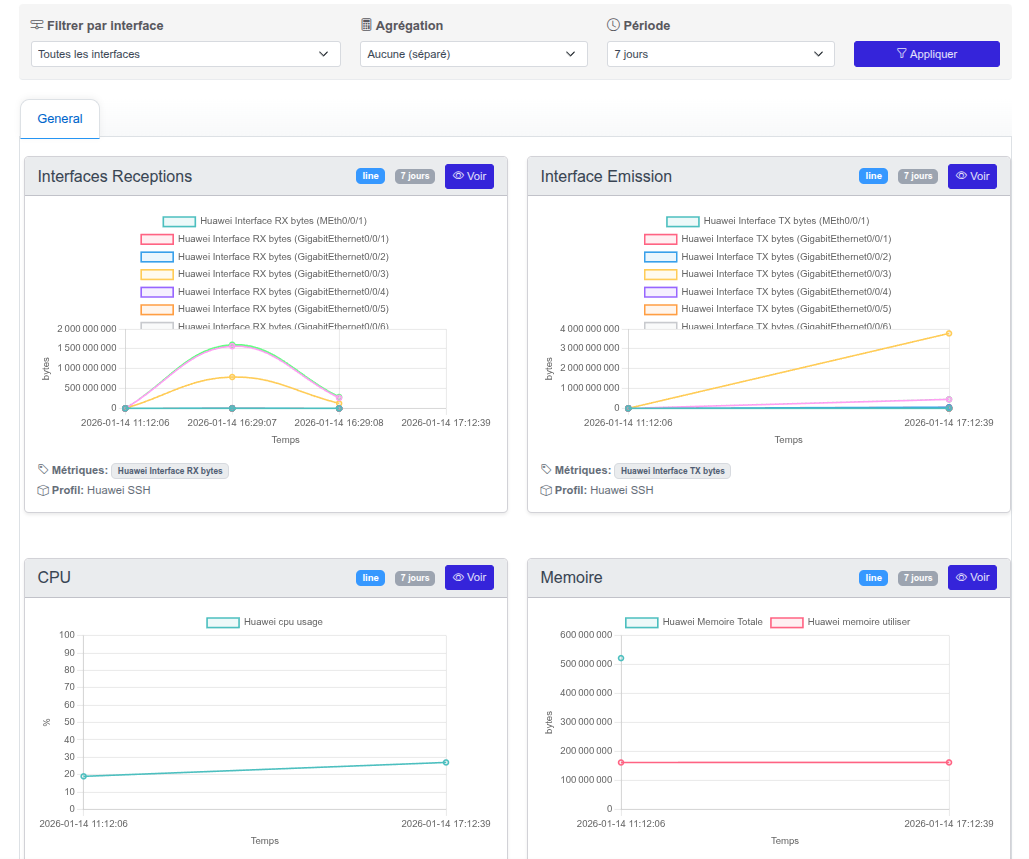
Monitoring Module

Anticipate failures
before your users

Custom SNMP and SSH collection, intelligent multi-channel alerts. Detect weak signals and resolve problems before the incident.

Dashboard — Core-Switch-01

24/7 Monitoring

Continuous infrastructure monitoring

SNMP + SSH

Dual collection for total visibility

Multi-channel alerts

Email, Teams, Slack, webhooks

Custom-built

Customizable dashboards and thresholds

The challenge

The limits of traditional monitoring

Most network teams discover problems when users call. Traditional monitoring tools are often complex to configure, limited in collection capabilities and require multiple software to cover all needs.

  • Late alerts

    You discover incidents when users call. Without well-configured thresholds, monitoring is passive: it observes instead of anticipating.

  • SNMP alone is not enough

    Many critical data points (temperature, power supplies, proprietary metrics) are inaccessible via standard SNMP. You lose visibility.

  • Multiple fragmented tools

    One tool for monitoring, another for graphs, a third for alerts. Information is scattered, diagnostics are slowed down.

  • Complex configuration

    Zabbix templates, Nagios plugins, agents to deploy: hours of configuration for each new device before getting a single metric.

Sound familiar?
Intelligent Networks solves these.

Feature

All-in-one SNMP monitoring

Intelligent Networks natively integrates SNMP v2c and v3 collection to monitor all your network devices. CPU, memory, interfaces, traffic, latency: essential metrics are collected automatically and stored for historical analysis.

The integrated MIB explorer allows you to browse each device's SNMP tree, identify relevant OIDs and add them to monitoring in a few clicks, without editing configuration files.

  • Native SNMP v2c and v3
  • CPU, memory, interfaces, traffic
  • Configurable collection intervals
  • Long-term data history
  • Trend analysis and capacity planning
  • Common OIDs pre-referenced

Integrated MIB explorer

1

Browse the tree

Visually browse the device MIB tree

2

Identify OIDs

Filter by name, OID or description to find the metric

3

Add to monitoring

One click is enough to monitor the new indicator

SSH collection process

1

Define the command

E.g.: <code>show environment temperature</code>

2

Configure the regex

Extract the relevant value from the output

3

Periodic execution

Automatic collection and data storage

Feature

Customizable SSH collection

SNMP does not cover everything. Many devices expose critical data only through their command-line interface: component temperatures, power supply status, vendor-specific metrics. With Intelligent Networks SSH collection, anything accessible via command line becomes monitorable.

Anything accessible via command line becomes monitorable.

  • Free SSH commands

    Execute any CLI command on your devices: show, display, get, proprietary vendor commands.

  • Regex extraction

    Configure an extraction pattern to isolate exactly the value to monitor from the command output.

  • Reusable templates

    Create metric templates and apply them to multiple devices in one click. Preconfigured templates available for common devices.

Preconfigured templates for common devices
Feature

Customizable dashboards

Each user can build their own monitoring views. Whether you are a network technician, operations manager or CTO, you see the metrics that matter to you, organized according to your logic.

  • Varied chart types

    Time-series curves, histograms, gauges: choose the representation best suited to each metric.

  • Flexible organization

    Organize your dashboards by site, device type, criticality or business logic. Each view addresses a specific need.

  • Accessible from any browser

    No thick client to install. Your dashboards are accessible from any workstation via web browser.

  • Fullscreen mode for NOC screens

    Display your dashboards in fullscreen on control room screens for permanent visual monitoring.

View types

Curves

Time evolution

Histograms

Comparison

Gauges

Instant value

Fullscreen

NOC mode

Email

Alert details sent directly to the relevant administrators

System alerts

Centralized console with complete history and resolution actions

Webhooks

Teams, Slack, ITSM ticketing or any compatible system integration

Feature

Multi-channel alert system

For each monitored metric, define warning and critical thresholds with appropriate trigger conditions. When a threshold is breached, the system simultaneously notifies via multiple channels to ensure the right people are reached.

  • Granular thresholds

    Define warning and critical thresholds for each metric. Available operators: greater than, less than, equal, not equal.

  • Reusable profiles

    Create threshold profiles and apply them to multiple devices. Override per device if needed.

  • 3 simultaneous channels

    Email, system alerts and webhooks run in parallel. Each channel is independently configurable.

  • Dedicated alert dashboard

    View active alerts, browse history and track resolution actions from a centralized interface.

Ready-to-use metrics

Start monitoring immediately with preconfigured metrics for common devices

System resources
  • CPU usage
  • Memory usage
  • Disk space
  • Temperature
Network interfaces
  • Inbound / outbound bandwidth
  • Errors and discards
  • Interface status
  • Packet counters
Devices
  • Uptime
  • Power supply status
  • Fan status
  • Firmware version

Why choose Intelligent Networks?

Network monitoring feature comparison

Feature Intelligent Networks Zabbix / Nagios PRTG / Datadog
SNMP v2c / v3
Customizable SSH collection Scripts Limited
Integrated MIB explorer
Customizable dashboards
Multi-channel alerts (Email, Webhooks) Plugins
Preconfigured templates Community
Long-term data history Paid
NOC mode (fullscreen) Grafana
Configuration simplicity Simple Complex Medium
Cost per sensor / device No Free Yes

Concrete use cases

How our clients use the Monitoring module daily

Proactive monitoring

Detect CPU and memory saturation before they impact users. Warning thresholds alert you in advance, giving you time to intervene before the problem becomes visible.

Proprietary metrics

Monitor vendor-specific data inaccessible via SNMP through SSH collection. Component temperatures, power supply status, proprietary counters: everything becomes visible and historized.

NOC screen

Display your dashboards on control room screens in fullscreen mode. Real-time infrastructure status view, automatic refresh, immediate anomaly identification.

Capacity planning

Analyze traffic and resource usage trends to anticipate bandwidth and capacity needs. Long-term history lets you plan infrastructure upgrades.

Incident management

Alert, Teams notification, diagnostics, resolution: all in one platform. Webhooks integrate with your ticketing tool to automatically create incidents and speed up processing.

Monthly reporting

Export performance data for client or management reports. Availability, usage trends, resolved incidents: all metrics are accessible and exportable.

Ready to anticipate instead of react?

SNMP and SSH monitoring, intelligent alerts and dashboards in one platform